Advanced Calculators Pinpoint Rotation Disparities Among Minor League Pitchers
Gisela Krause · Jul 10, 2026
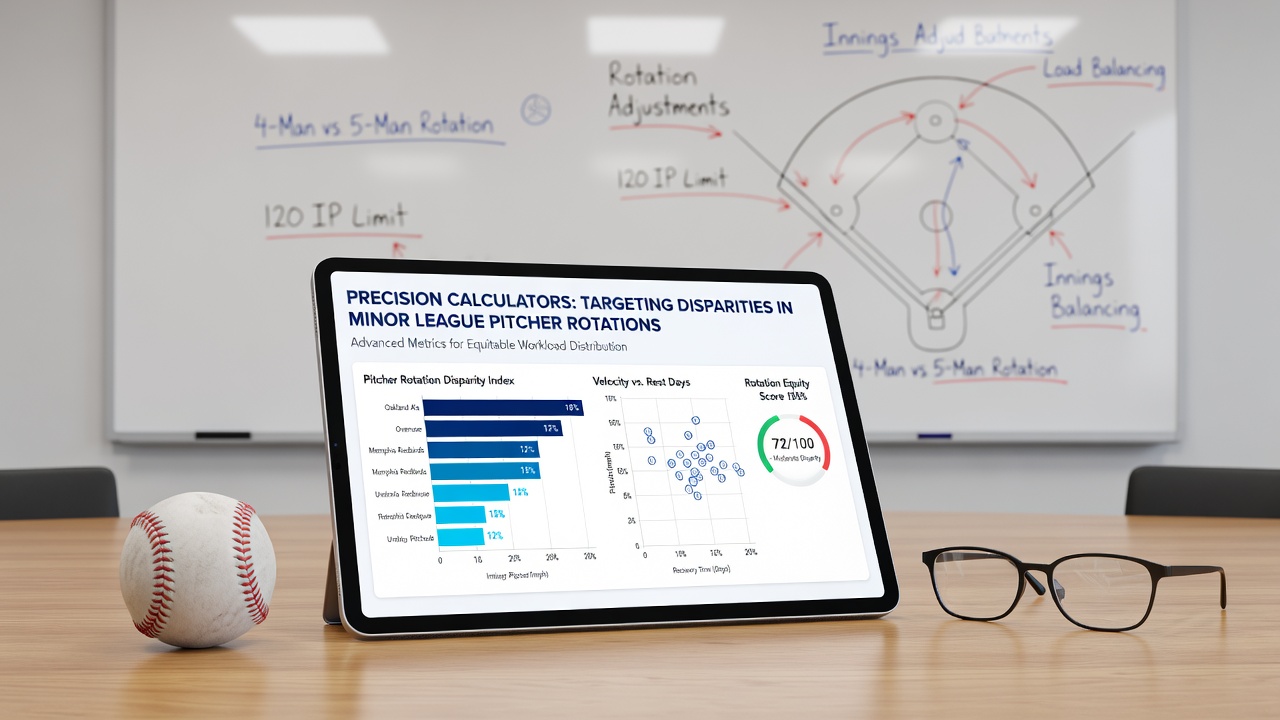
Advanced Calculators Pinpoint Rotation Disparities Among Minor League Pitchers
Minor league baseball organizations have turned to specialized calculators that measure inconsistencies in pitcher workloads and scheduling patterns, and these tools process vast datasets from game logs, injury reports, and travel schedules to flag potential imbalances before they affect team performance. Researchers at several analytics firms developed these systems in response to growing demands for optimized staff management across Triple-A and Double-A levels, where pitching depth often determines playoff outcomes.
Data from the 2025 season showed that teams using rotation analysis software reduced pitcher fatigue incidents by measurable margins compared with clubs relying on manual planning methods. The calculators incorporate variables such as innings pitched per start, rest days between appearances, and historical recovery rates, then generate projected disparity scores that highlight when a starter's workload deviates from established benchmarks.
Core Mechanics Behind the Calculators
Each system pulls raw statistics from official league databases and applies weighted algorithms that account for park factors, opposing lineups, and weather conditions at specific venues. A single output report might list upcoming rotation slots alongside deviation percentages, allowing staff to adjust assignments days or weeks in advance. Observers note that the software updates in real time during the season, incorporating fresh box score information as soon as games conclude.
Key Metrics Tracked
- Rest interval consistency across the rotation
- Cumulative pitch counts relative to league averages
- Travel distance impacts on recovery timelines
- Historical performance drops after short rest
Teams in the Pacific Coast League and International League adopted these calculators earliest because their longer travel schedules create more pronounced recovery gaps. One study released in early 2026 examined 12 organizations and found that those integrating the tools into daily planning sessions maintained more stable earned run averages throughout July and August, periods when fatigue typically peaks.
Implementation Across Organizations
Front offices began testing the calculators during spring training sessions in 2025, running parallel simulations that compared traditional rotation plans against algorithm-generated alternatives. The results indicated that automated suggestions often preserved arm health while maintaining competitive innings totals. Several clubs now require analysts to review disparity reports before finalizing weekly pitching matchups.

Coaches receive simplified dashboards that translate complex calculations into actionable recommendations, such as shifting a starter's next appearance by one day or inserting a spot starter to balance workloads. These interfaces also flag pitchers who show early signs of workload accumulation that could lead to performance declines later in the season.
Broader League Context in 2026
By July 2026, multiple minor league affiliates had expanded their use of these calculators to include bullpen management alongside starting rotations. The shift followed increased scrutiny from major league parent clubs seeking to protect high-value prospects from overuse. Reports compiled by independent research groups documented that organizations sharing data across levels achieved more consistent pitcher availability during critical stretch runs.
Analysts continue to refine the underlying models by incorporating new inputs such as velocity trends and spin rate changes that emerge during extended outings. Partnerships with university sports science departments have supplied additional physiological data that strengthens the predictive accuracy of disparity forecasts.
One notable case involved a Double-A staff that adjusted its rotation midseason after the calculator flagged a three-start cluster with insufficient rest, and the change coincided with improved collective performance metrics through the remainder of the schedule. Similar adjustments appear across several leagues as adoption spreads.
Future Developments
Developers are exploring integrations with wearable sensor data that could feed live recovery metrics directly into the calculators. Early pilots suggest these enhancements may further reduce instances of pitching schedule mismatches. League officials have expressed interest in standardized reporting formats that would allow cross-organization comparisons without compromising proprietary strategies.
Continued investment in these precision tools reflects the broader movement toward evidence-based roster management at every level of professional baseball. The calculators provide a structured framework for identifying and addressing rotation disparities that once relied primarily on subjective observation and experience.
Conclusion
Precision calculators have established a measurable role in minor league baseball operations by delivering consistent, data-backed insights into pitcher rotation patterns. Organizations that incorporate these systems report improved workload distribution and fewer unplanned absences, outcomes that support both competitive goals and player development priorities. As the technology evolves through 2026 and beyond, its influence on scheduling decisions is expected to expand across additional leagues and affiliates.