Decoding Cross-Market Volatility: Scanner Algorithms Reveal Discrepancies in Niche League Dynamics
Gisela Krause · Jun 7, 2026
Decoding Cross-Market Volatility: Scanner Algorithms Reveal Discrepancies in Niche League Dynamics
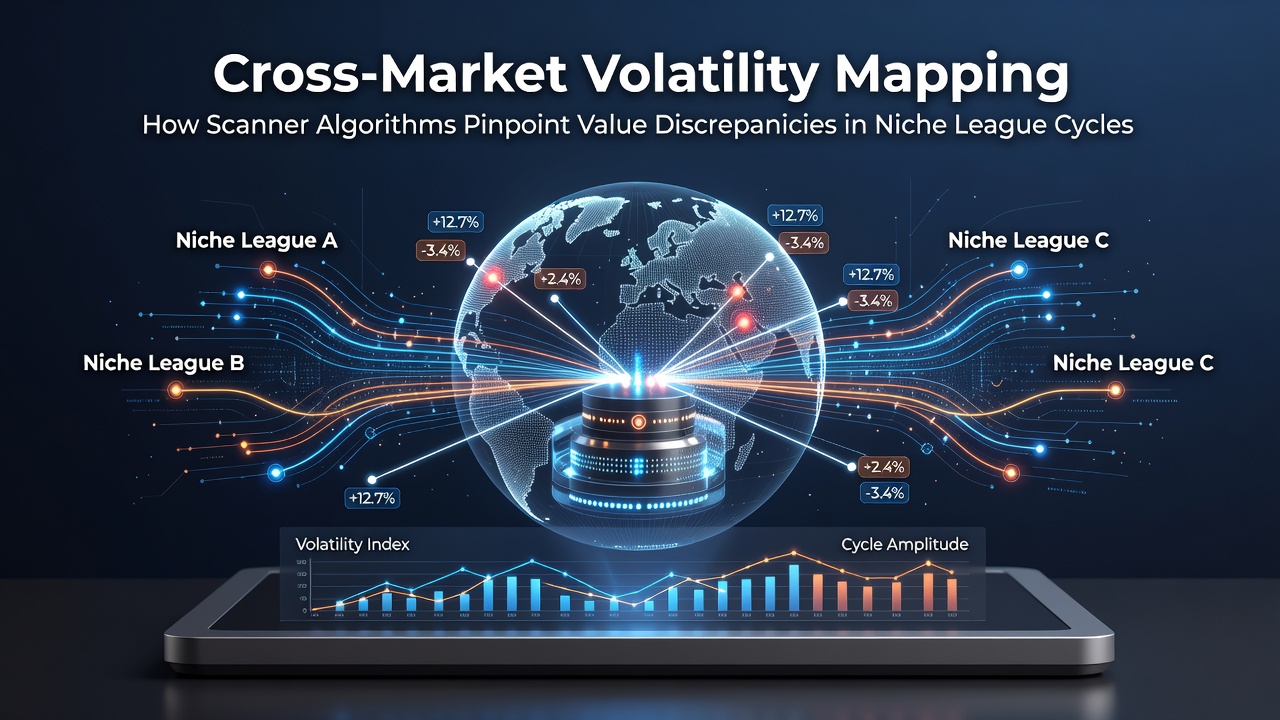
Scanner algorithms have become central tools for identifying value discrepancies in betting markets that operate outside major leagues, where odds movements often follow distinct seasonal patterns and lower liquidity creates frequent misalignments. These systems map volatility across bookmakers by tracking real-time shifts in odds for competitions such as second-tier volleyball circuits, regional handball divisions, and emerging esports brackets that receive limited mainstream attention. Data compiled in June 2026 shows increased activity in these segments as operators expand coverage to smaller events, which in turn generates more opportunities for algorithmic detection of pricing inconsistencies.
Core Mechanics Behind Volatility Mapping
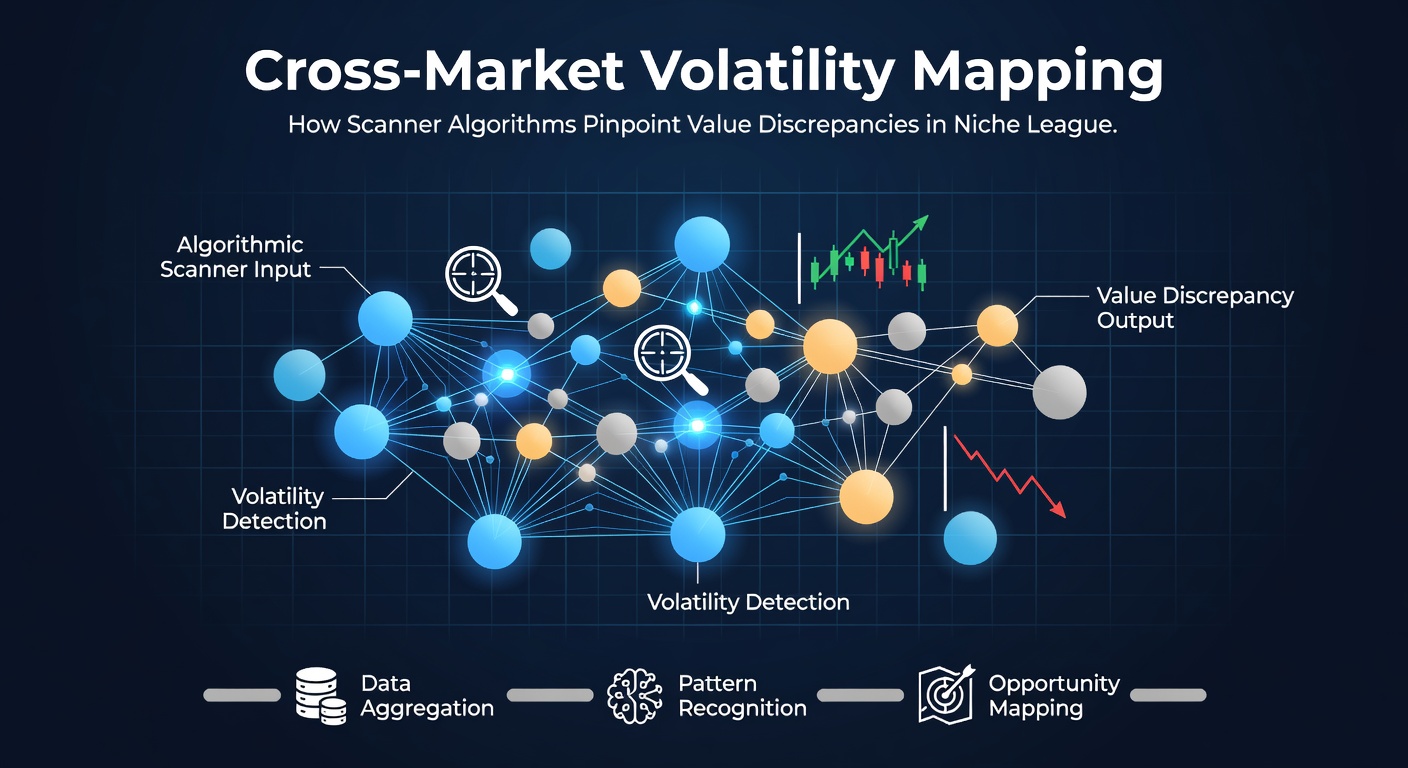
Volatility mapping works by aggregating historical and live odds feeds from multiple platforms, then applying statistical models that flag deviations exceeding predefined thresholds. Algorithms calculate implied probabilities for each outcome while factoring in market depth, time until event start, and cross-league correlations that influence pricing in related competitions. When one bookmaker adjusts lines faster than others during a niche league cycle, the resulting spread becomes visible to scanners that continuously compare these inputs. Researchers at institutions focused on quantitative finance have noted that such discrepancies appear more regularly in leagues with fewer participants and thinner betting volumes, where information asymmetry persists longer than in high-profile fixtures.
Application to Seasonal League Patterns
Niche league cycles often exhibit predictable volatility spikes tied to roster changes, travel schedules, and fixture congestion that major markets absorb more efficiently. Scanners isolate these moments by layering data from past seasons onto current odds streams, highlighting periods when value gaps widen because bookmakers update at different speeds. One documented instance involved lower-division basketball tournaments where mid-season coaching alterations triggered rapid line movements across several operators; algorithms captured the resulting arbitrage windows before manual traders could react. Observers note that June 2026 brought additional layers of complexity as several European regional leagues adjusted their calendars, creating fresh data points for mapping tools to process.
Integration of Multi-Source Data Streams
Effective mapping requires simultaneous ingestion of odds from diverse geographic operators, which algorithms normalize through currency conversion and margin adjustment before comparison. This process accounts for variations in betting rules across jurisdictions and incorporates supplementary indicators such as player availability feeds and weather data for outdoor events. Studies conducted by the University of Nevada Las Vegas gaming research group demonstrate that combining these variables improves detection accuracy in low-liquidity environments where single-source analysis frequently misses subtle discrepancies. The resulting outputs allow users to prioritize markets showing sustained volatility rather than isolated spikes that may reflect temporary noise.
Case Examples from Emerging Competitions
Take the case of certain Asian table tennis circuits where algorithms tracked odds drifts during extended qualification rounds in early summer 2026; scanners identified consistent value on underdog selections when European bookmakers lagged behind Asian exchange movements. Another example emerged in South American futsal leagues, where fixture rescheduling due to venue issues created cross-platform gaps that persisted long enough for automated systems to lock in positions. These instances illustrate how mapping techniques adapt to league-specific rhythms rather than applying uniform thresholds across all sports. Figures from the European Gaming and Betting Association indicate that algorithmic tools now account for a measurable share of activity in these segments, though exact volumes remain proprietary.
Technical Considerations for Accuracy
Developers refine scanner models by back-testing against historical volatility clusters, adjusting parameters to reduce false positives that arise from rapid but legitimate market corrections. Latency management becomes critical because niche events often feature lower update frequencies, requiring algorithms to distinguish genuine discrepancies from delayed feeds. Parallel processing enables simultaneous evaluation of dozens of related markets, revealing hidden correlations such as how performance in one regional division influences odds in adjacent competitions. Those who maintain these systems emphasize continuous calibration, particularly around June when many leagues transition between phases and introduce new variables into the data environment.
Conclusion
Cross-market volatility mapping continues to evolve as scanner algorithms incorporate broader datasets and refined statistical filters tailored to niche league characteristics. The approach delivers measurable edges by focusing on segments where liquidity constraints and seasonal cycles generate repeatable pricing inconsistencies across operators. As coverage of smaller competitions expands through 2026 and beyond, these tools remain positioned to surface opportunities that manual monitoring would overlook, provided users maintain awareness of platform-specific rules and data reliability.