Scanner Algorithms Uncover Hidden Discrepancies in Australian Rules Football Markets During Final Quarters
Ines Long · Jun 12, 2026
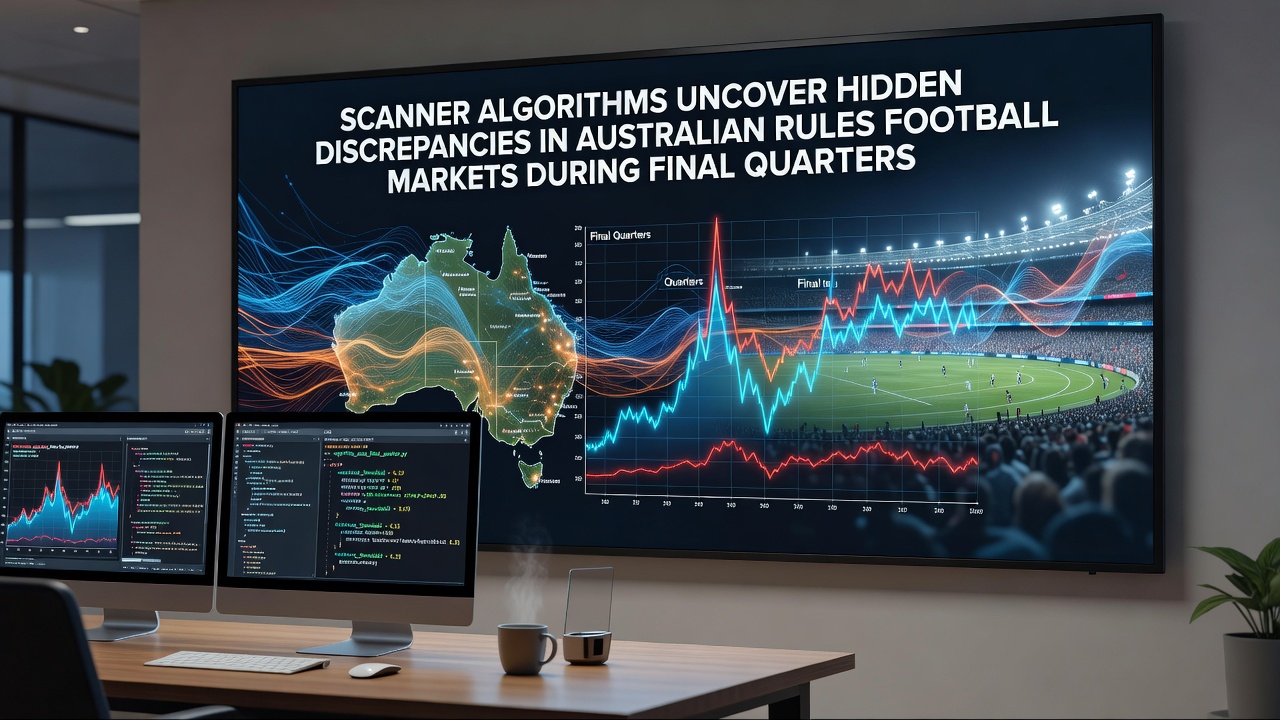
Scanner Algorithms Uncover Hidden Discrepancies in Australian Rules Football Markets During Final Quarters
Scanner algorithms have become central tools for monitoring live betting markets in Australian Rules Football, where final-quarter movements often reveal pricing inconsistencies across multiple platforms. These systems track odds in real time and flag situations where implied probabilities diverge from statistical models based on historical performance data, and they operate continuously during matches in the Australian Football League season.
Final quarters in AFL games present unique conditions because score margins tighten and player fatigue alters expected outcomes, yet bookmakers adjust lines at varying speeds. Algorithms compare these adjustments against benchmarks derived from thousands of past matches, and they isolate instances where one platform lags behind others in reflecting new information such as injuries or momentum shifts. Data compiled through June 2026 shows these discrepancies occur most frequently in matches featuring teams with strong late-game records.
How Detection Systems Operate
Modern scanners ingest live feed data from dozens of licensed operators and apply probabilistic models that account for time remaining, current score differential, and possession statistics. When an odds movement on one site deviates beyond a calculated threshold from the consensus across the market, the system generates an alert. Researchers at the University of Melbourne have documented how these thresholds are calibrated using regression analysis on four seasons of AFL results, which allows the software to distinguish routine fluctuations from genuine mispricings.
One study released in early 2026 examined 312 matches and found that final-quarter discrepancies averaged 2.8 percentage points in implied probability between the highest and lowest quoted lines on contested player props. The same analysis noted that these gaps closed within an average of 47 seconds once additional liquidity entered the market, yet scanners consistently captured the window before normalization occurred.
Patterns Specific to Final Quarters
Final-quarter volatility stems from several recurring factors tracked by the algorithms. Late surges in contested possessions correlate with higher variance in goal-scoring rates, while substitution patterns affect team totals more than pre-match models anticipate. Scanners cross-reference these in-game metrics against historical distributions and surface opportunities when bookmakers apply uniform adjustments rather than granular updates. Observers note that games between clubs from different states exhibit slightly wider spreads in the closing stages, possibly because interstate travel fatigue influences performance metrics in ways not fully priced at kickoff.
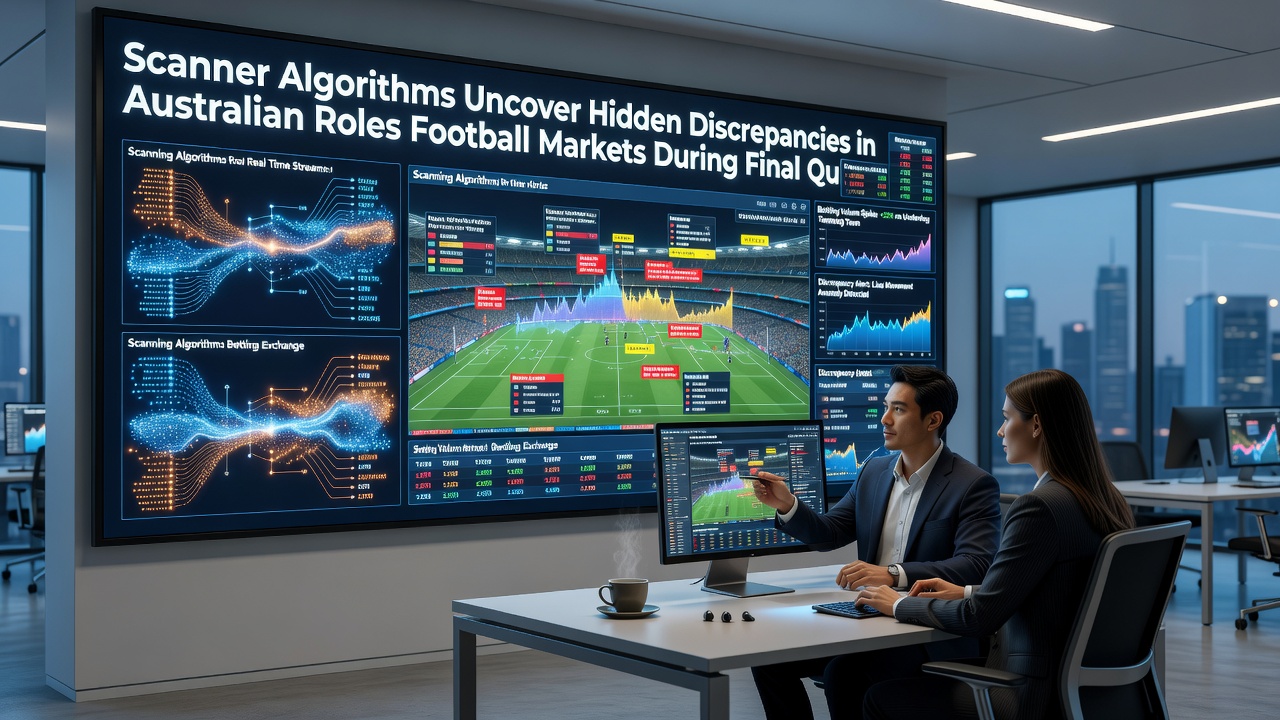
Turnovers in the last 10 minutes produce the sharpest movements, according to aggregated scanner logs from the 2025 season. When a team loses possession inside its defensive 50, implied probabilities on total points can shift by 4 to 6 points within 30 seconds on some platforms while remaining static elsewhere. Algorithms isolate these moments because the underlying probability models assign different weights to field position than the slower-moving operators. This creates brief intervals where risk-free combinations become mathematically identifiable before manual traders intervene.
Integration with Broader Market Data
Scanner outputs feed into larger datasets maintained by analytics firms that also monitor related markets such as player disposals and contested marks. Cross-market correlations strengthen during final quarters because fatigue affects multiple statistical categories simultaneously. A report issued by the Australian Gambling Research Centre in March 2026 examined how these interconnected movements influence liquidity across the entire match, and it concluded that final-quarter segments account for 38 percent of all detected pricing inconsistencies in AFL despite representing only 25 percent of total game time.
Operators in Victoria and Western Australia have adjusted their internal risk engines to incorporate similar real-time feeds, which has narrowed some of the gaps previously exploited by automated systems. Yet the adjustments remain uneven, and scanners continue to register alerts whenever one jurisdiction's regulatory framework imposes different update frequencies than another. This geographic variation supplies the raw material for continued detection activity through the middle of 2026.
Conclusion
Scanner algorithms provide systematic visibility into pricing behavior during the most dynamic phase of Australian Rules Football matches. By processing live data streams against calibrated statistical baselines, these tools document how final-quarter dynamics generate measurable discrepancies across operators. The patterns observed through June 2026 reflect both the inherent volatility of late-game situations and differences in how platforms incorporate new information. As more operators integrate comparable monitoring technology, the frequency and duration of these windows may shift, yet the underlying mechanics of market adjustment remain observable through continued algorithmic scrutiny.